Overlay
Sector trends

Farm business management: How to review your farm business

As reductions in the Basic Payment Scheme take effect in England, the Agriculture and Horticulture Development Board (AHDB) is helping farmers analyse their businesses for a more profitable future.

With reductions in the English Basic Payment Scheme (BPS) 2021, farmers and growers who rely on this income will need an active approach. AHDB’s Farm Business Review service, funded by the Department for Environment, Food & Rural Affairs (Defra) Future Farming Resilience Fund, is designed to help those most affected to prepare.

Aimed at beef, sheep, dairy, cereal and oilseed producers across England, the free and impartial Farm Business Review offers: 

  • an online self-assessment tool

  • a half-day consultation with a farm business consultant

  • peer support

  • in-depth, context-specific advice, either in: cost benchmarking with a Farmbench tool; agri-business appraisal (accounts and budgeting) to support planning and succession; or, a carbon audit

The service will only run until February 2022, and can be accessed at AHDB Farm Business Review. This range of information and resources will also help businesses navigate the changes to agricultural policy.

Farm business management: further help

The Farm Business Review online tool has three elements: the BPS Impact Calculator; Business Resilience Assessment; and KPI Express Calculator.

Research suggests that BPS makes up around 60% of UK farm net income. This shows there is a significant reliance on BPS in order to realise a sustainable profit but, by 2028, farmers will no longer receive these payments. 

Instead, new payment systems will be based on environmental outcomes and public goods. With this in mind, it is important to prepare now for this upcoming change:

  • assess the impact

  • consider income

  • talk and explore

Rachael Chamberlayne, AHDB Business Tools Senior Manager, says: “Our BPS Impact Calculator allows you to see the impact the reduction in payments will have on your farm business, so you can think about what you might need to do to make up any shortfall. Enter your 2020 BPS payment and in a matter of seconds, you’ll have the result.”

For example, if a farm’s 2020 BPS income was £17,500, the following reductions can be expected.

The decreases in BPS between 2021 and 2024 have been decided by Defra, and operate like income tax bands. For example, if a claim is worth £40,000, a 10% reduction would only apply to income above the £30,000 threshold, and for the first £30,000 a 5% reduction would apply.

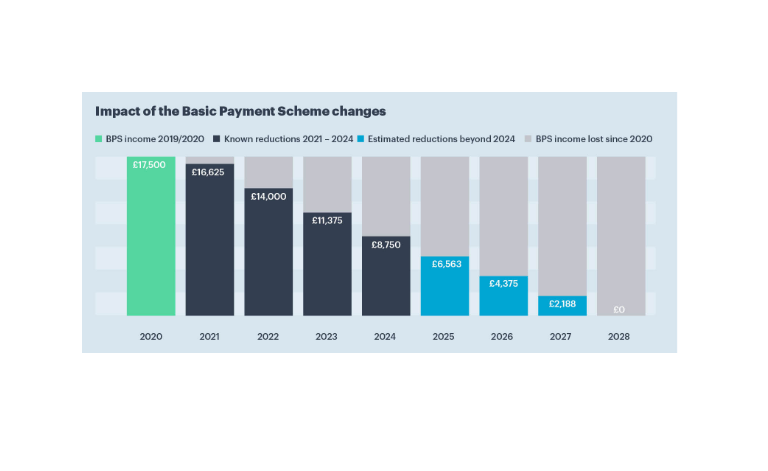
Defra has not yet announced what reductions will apply beyond 2024, so AHDB have assumed a straight-line reduction to zero beyond 2024.

The second element of the Farm Business Review is the Business Resilience Assessment. This self-assessment helps rate key business areas, identifying strengths and areas for development and improvement.

The Business Resilience Assessment is based on characteristics that set the highest-performing farms apart from the rest. AHDB’s Horizon report research found that, regardless of sector or farm size, the top 25% of performers work hard to:

  • minimise overhead costs

  • set goals and budgets

  • compare with others and gather information

  • understand the market

  • focus on detail

  • have a mindset for change and innovation

  • continually improve people management

  • specialise

Lastly, the KPI Express Calculator helps businesses understand costs, since comparing performance helps businesses become profitable and sustainable. Its detailed approach might not be the natural place for some farmers to begin, but it is worthwhile, nonetheless.  

Chamberlayne says that simple key performance indicators (KPIs) that build from uncomplicated, ready-to-hand data are the best place to start. They should lead to a change in farm performance, resulting in increased resilience across the industry and reductions in environmental impacts.

“Our ultimate ambition is to create a suite of KPIs that are accessible and consistent for the whole industry to use. KPIs enabling you to progress from any point, starting where you feel most comfortable, where you have data for, and [what] you are interested [in],” she explains.

Specifically, it aims to: 

  • Support businesses to start benchmarking at an entry level: Collecting the right data and adding context can build confidence in datasets that are already familiar.

  • Help farms adopt further KPIs to move through the benchmarking levels: Using new data or doing more with existing data can help build a more informed picture of performance and how different areas link.

  • Engage with top performers. Delving into the detail helps apply insight and purpose, allowing farmers to make decisions in a strategic way.

  • Create accessible and consistent data that is familiar and easily accessible from farm business accounts or farm management software.

There are many potential indicators and metrics that can quickly cause confusion, frustration and lead to a lack of use. AHDB is keen to keep the KPIs simple while still being able to benchmark an entire business, which is why it has spent 12 months refining the KPIs, based on feedback and data from industry experts and farmers.

The result is a refined KPI Express element of the Farm Business Review tool, used and tested, along with KPIs with farmers’ real data.

Defining KPIs in farm business management

In order to calculate and compare KPIs, they must first be defined. Examples of dairy KPIs would be age at first calving and milk from forage, suckler herd and breeding flocks; whereas growing and finishing beef cattle might include KPIs on daily live weight gain. In cereals, KPIs such as diesel use and whole rotation gross margin would be used. 

A common KPI across all businesses is cost of production, although based on whole farm business data, such as audited accounts, and examined alongside net profit margin and net worth trend. 

Each KPI has a set of target ranges that show how the business is performing, and act as signposts to further information or support should the result not be where it should be.

This material is published by NatWest Group plc (“NatWest Group”), for information purposes only and should not be regarded as providing any specific advice. Recipients should make their own independent evaluation of this information and no action should be taken, solely relying on it. This material should not be reproduced or disclosed without our consent. It is not intended for distribution in any jurisdiction in which this would be prohibited. Whilst this information is believed to be reliable, it has not been independently verified by NatWest Group and NatWest Group makes no representation or warranty (express or implied) of any kind, as regards the accuracy or completeness of this information, nor does it accept any responsibility or liability for any loss or damage arising in any way from any use made of or reliance placed on, this information. Unless otherwise stated, any views, forecasts, or estimates are solely those of NatWest Group, as of this date and are subject to change without notice. Copyright © NatWest Group. All rights reserved.

scroll to top